Optimizing Scenarios
Play with the predefined scenarios
MiningMath allows you to learn with each scenario by providing standard parameters which simulate some common constraints that a mining company may face. Standard scenarios are listed and described below so you can identify the main changes made within the “Overview” tab.
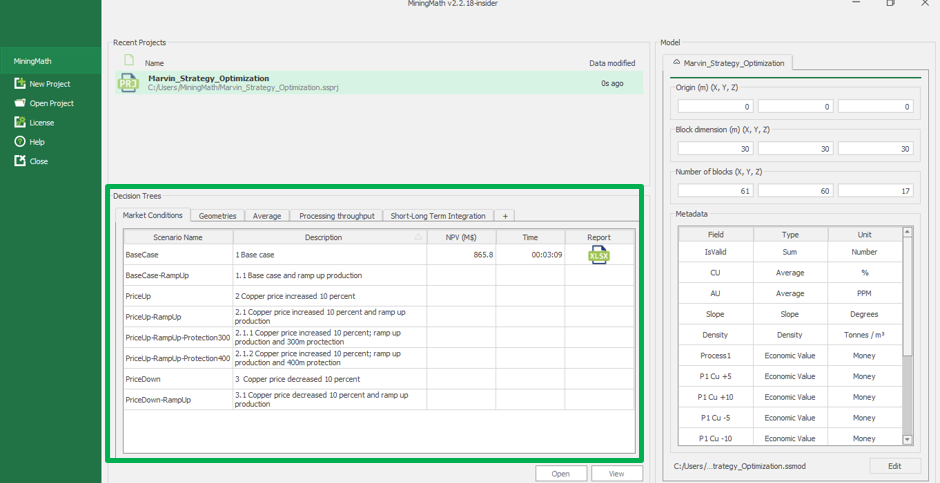
The ultimate goal of this practice is to prepare you to build Decision Trees, which allow you to organize scenarios in order to understand how variables influence one another and, consequently, how these variables determine the final NPV.
Database restrictions in MiningMath free version
When utilizing MiningMath’s free version, access to all software functionalities is restricted to the Marvin database, which comes pre-installed. This database is identified by its specific slopes, block dimensions, and model dimensions. In the event that these values have been changed for any reason, the original file can be downloaded here.
Market Conditions Decision Tree
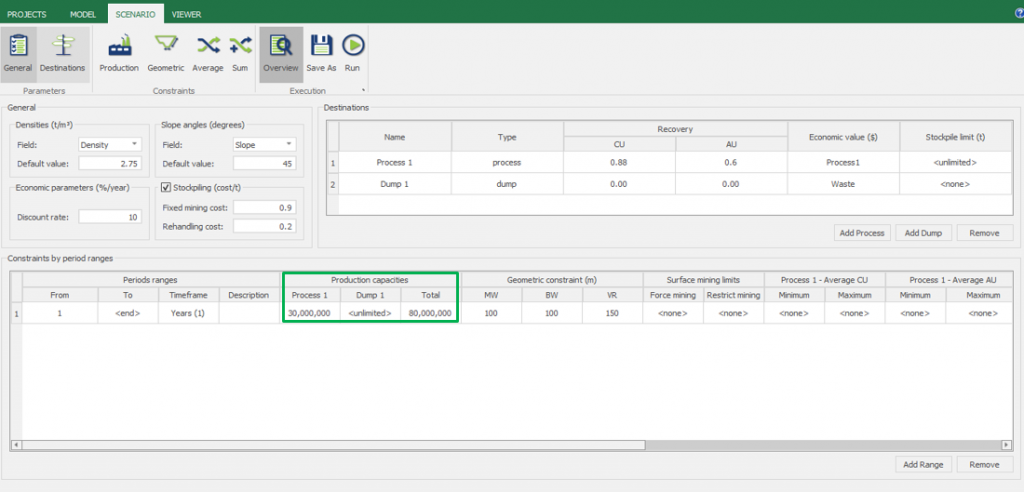
1) BaseCase
The Base Case consists of the initial scenario, with a uniform production capacity and without sum, average or surface mining limits.
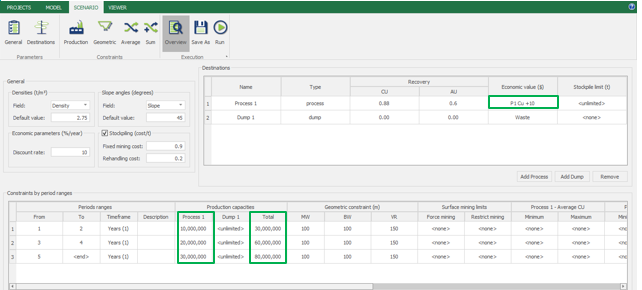
2) BaseCase-RampUp
While the base case considers a uniform production capacity, the BaseCase-RampUp scenario offers the possibility to vary the levels of production within the different timespans. We have an initial production capacity of 10Mton on the first 2 periods; 20 Mton on periods 3 and 4; and 30 Mton from period 5 until the end of the mine’s lifetime, with a total movement constraint of 30, 60, and 80 Mton, considering the increase of production within the time-frames mentioned.

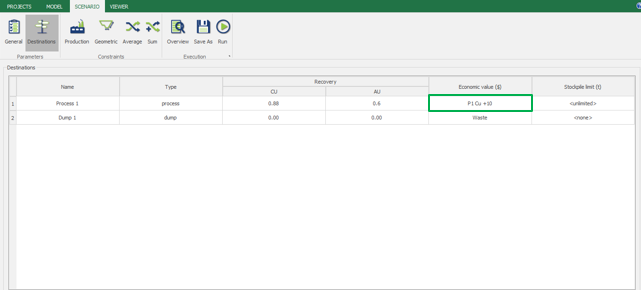
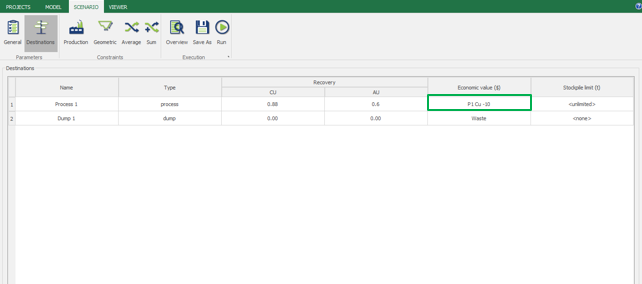
3) PriceUp and PriceDown
Scenarios “PriceUp” and “PriceDown” differ in relation to the basic scenario in the economic value used for the calculation of the P1 process, where there is an increase and a decrease of 10% at the copper selling price, respectively. In the destination tab, “P1 Cu +10” and “P1 Cu -10” were the values used for the process.
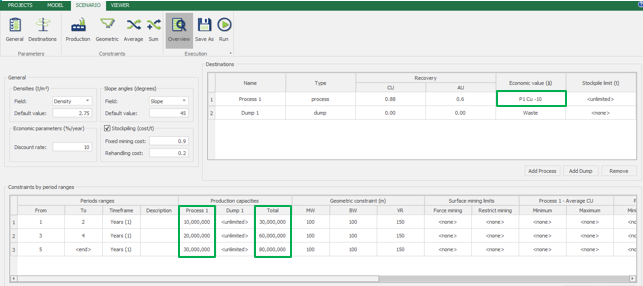
4) PriceUp-RampUp and PriceDown-RampUp
These scenarios consider a 10% copper selling price increase and decrease, and a ramp-up of the production capacity at the same time, as mentioned before.
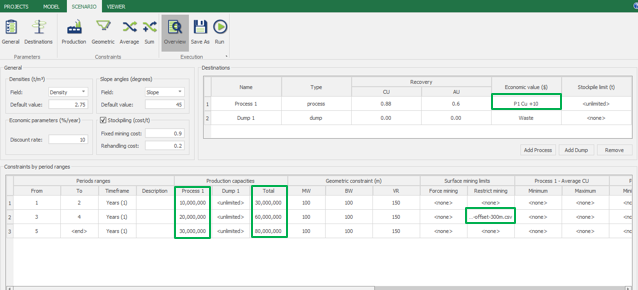
5) PriceUp-RampUp-Protection300 and PriceUp-RampUp-Protection400
This scenario considers a 10% copper selling price increase and a ramp-up of the products at the same time, as mentioned in the previous scenario. In addition, a restrict mining surface (this constraint is used to prohibit access to this area in a specific timeframe) was included up to the fourth period, since it may represent some legal constraints on a project.
Other Decision Trees
Below you can see a description of some scenarios of other Decision Trees.
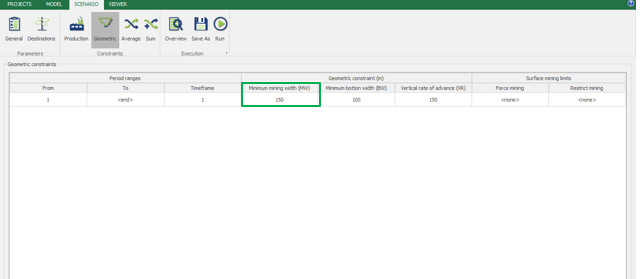
1) MW150 (Geometries Decision Trees)
The MW150 scenario considers different geometries from the base case at the geometric constraints. In this scenario, 150 meters was used as mining width (the horizontal distance between the walls of two surfaces that belonged to consecutive periods), and a vertical rate advance of 180 meters.
2) AvgCu (Average Decision Tree)
In the AvgCu scenario, blending constraints were added in the average tab to consider allowed at the process plant 0.5% as a minimum and 0.7% as a maximum average copper grade. The optimization will have to fulfill the P1 process capacity and, as an additional challenge, it has to meet this new set of parameters related to the Cu average content within the ore.

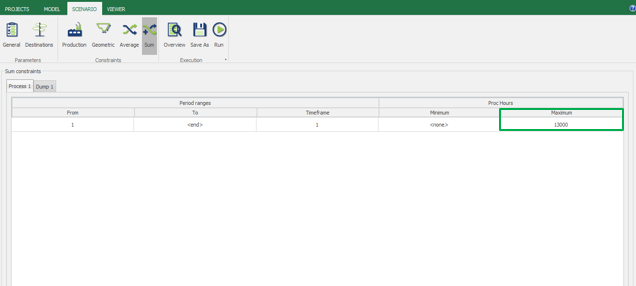
3) Proc13000h and Proc13000h-33Mt
(Process throughput Decision Tree)
Scenario Proc13000h considers 13.000 hours of processing equipment used as the maximum limit. This constraint was inserted at the sum tab and it controls variables such as rock type feeding, energy consumption, and any parameter controlled by its sum. Scenario Proc13000h-33Mt considers an increase of 10% in the production, inserted at the production tab beyond the parameters mentioned previously.
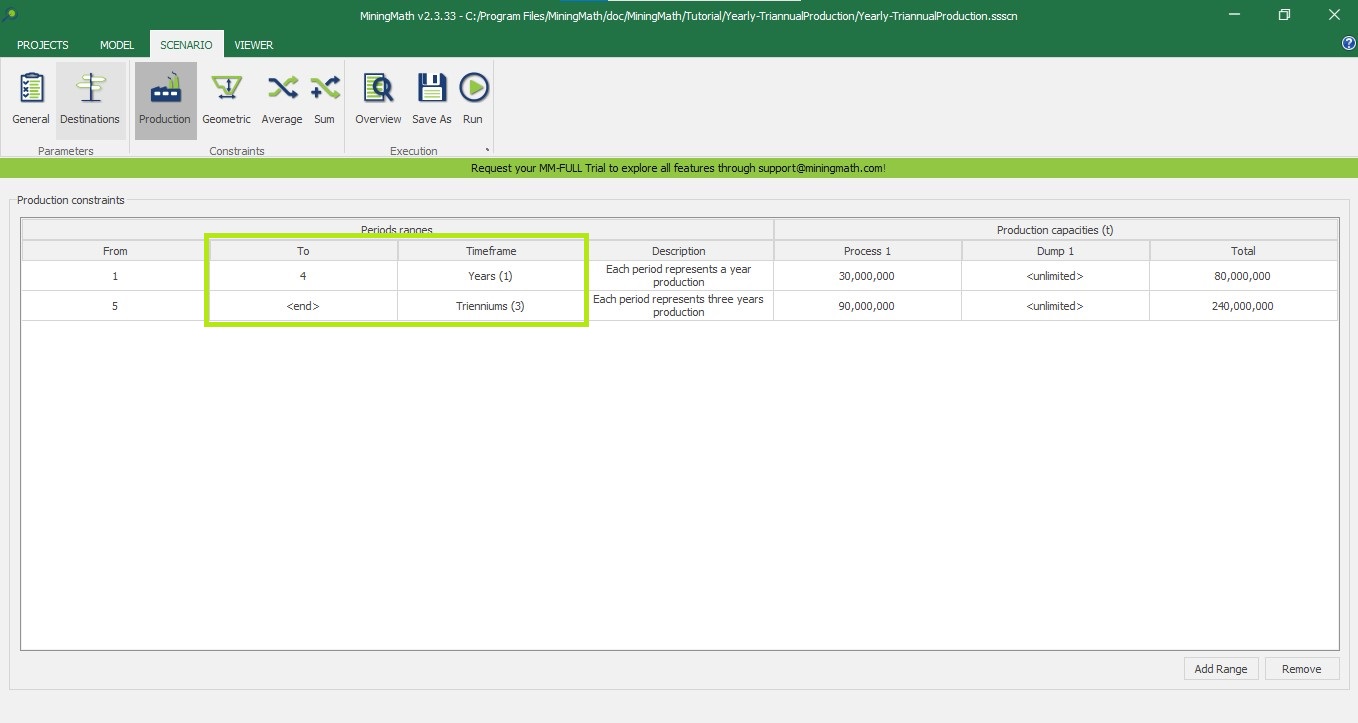
4) Yearly-TriannualProduction
(Short-Long Term Integration Decision Tree)
This considers a yearly production for period range 1-4 and triannual planning for range 5-end. This way is possible to integrate both short and long-term planning in a single run, facilitating the analysis and strategic definitions.
Any kind of timeframe can be used according to your needs.