
Bottleneck Analysis
Highlights
Effective bottleneck analysis is vital for mining operations to identify constraints in flows that limit profitability. MiningMath’s integrated approach ensures practical, iterative targeting of bottlenecks for optimized outputs.
- Simultaneous constraint optimization: MiningMath’s bottleneck workflows automatically locate and analyze limiting constraints across multiple operational variables, offering a unique method that avoids manual rework and accelerates scenario testing.
- Fast, model-driven refinement: MiningMath enables you to iterate over scenarios, refining models without rebuilding workflows. An exclusive capability that speeds up decision cycles.
- Academically validated and profit‑focused: Rooted in peer‑reviewed methods and used globally, the system prioritizes NPV-maximizing bottleneck resolutions rather than theoretical metrics, making it uniquely grounded in financial impact and operational practicality.
Bottleneck Analysis involves generating scenarios to conduct extensive searches for solutions with fewer violations while preserving NPV, keeping geometries, optimizing mining operations, and reducing risks. This allows for the discovery of more efficient and sustainable solutions that meet specific constraints and needs of the mine.
In Bottleneck Analysis, after analyzing a desirable scenario it is possible to identify the constraint/s with demanding requirements that directly impact the optimization results and cause significant violation issues. Then, scenarios should be created by relaxing these demanding parameters, enabling users to make decisions to mitigate risks and ensure project viability.
Example
Required dataset
Preinstalled Marvin deposit. It can also be downloaded here.
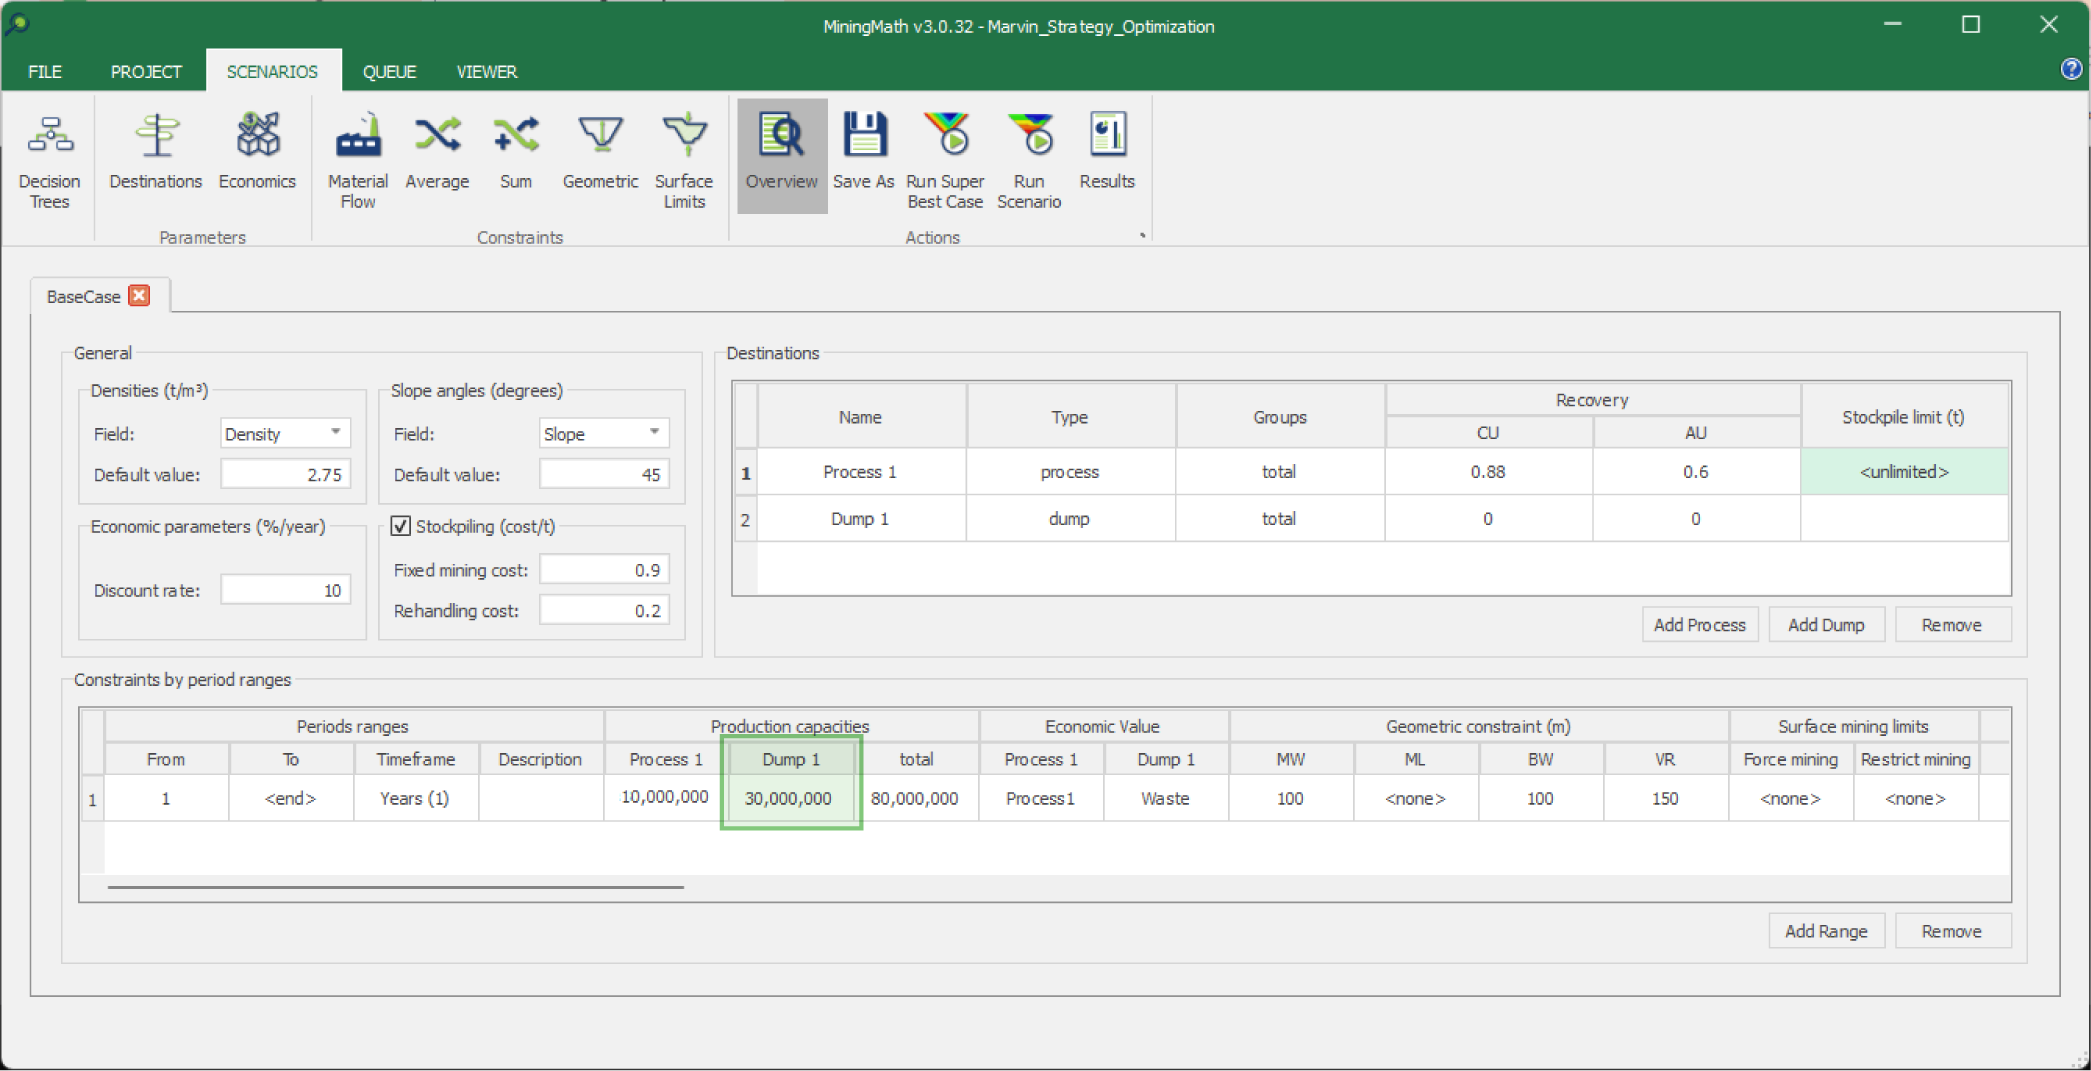
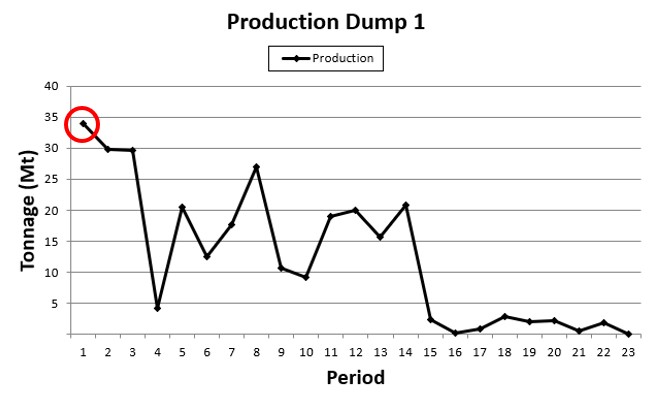
Consider the base scenario overview and the respective report on the dump production. Note how the first period has violated the 30Mt constraint.
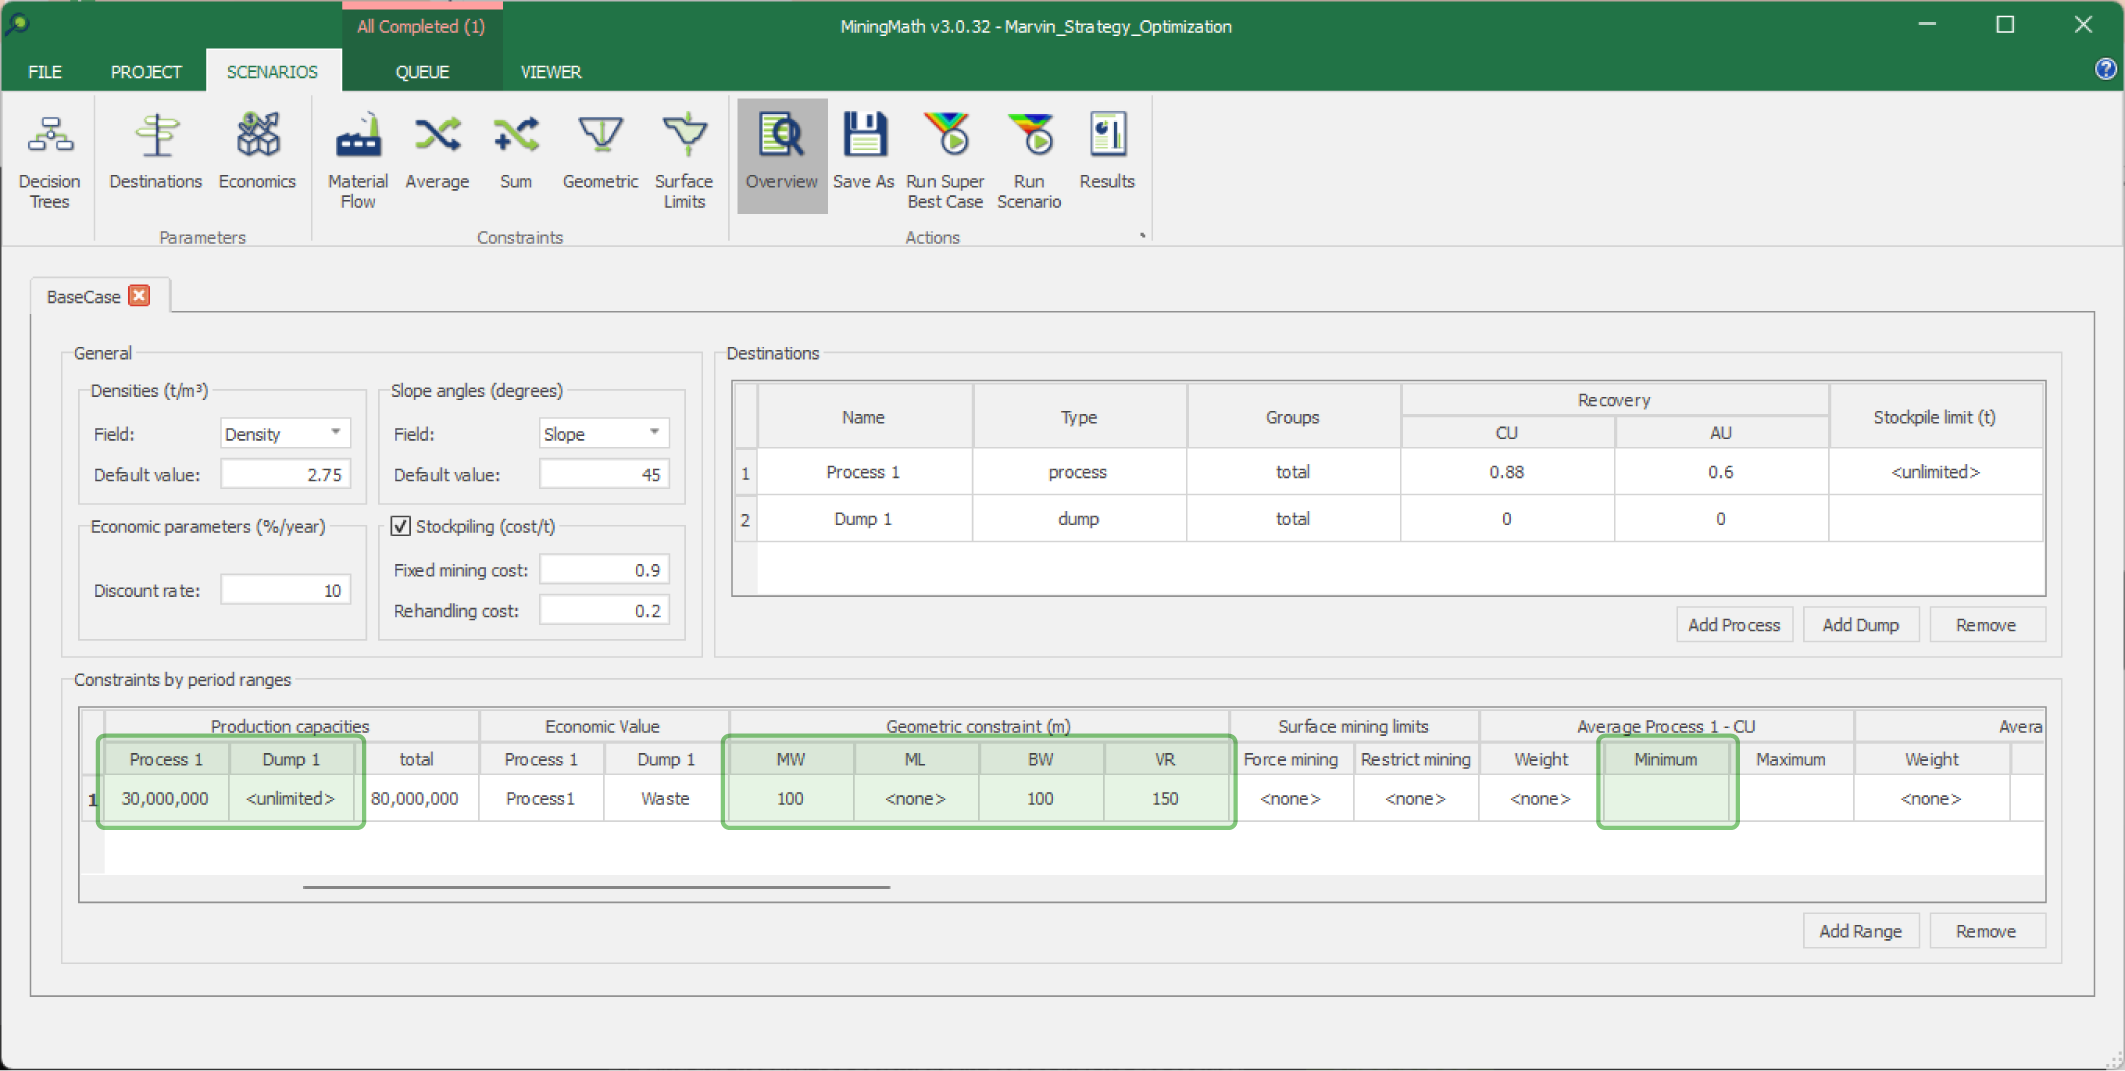
A Bottleneck Analysis can help us identifying the constraint/s with demanding requirements that directly impact the optimization results and cause the violation in the dump production. Four different scenarios are built using a decision tree to analyze different values for dump production limits, minimum average of CU and vertical rate of advance.
Note: To decide which parameters need to be changed, you can consider the contraint priority order that MiningMath employs in order to always deliver a solution. However, adjustments usually depend on the unique characteristics of each project and the flexibility available to modify its requirements.
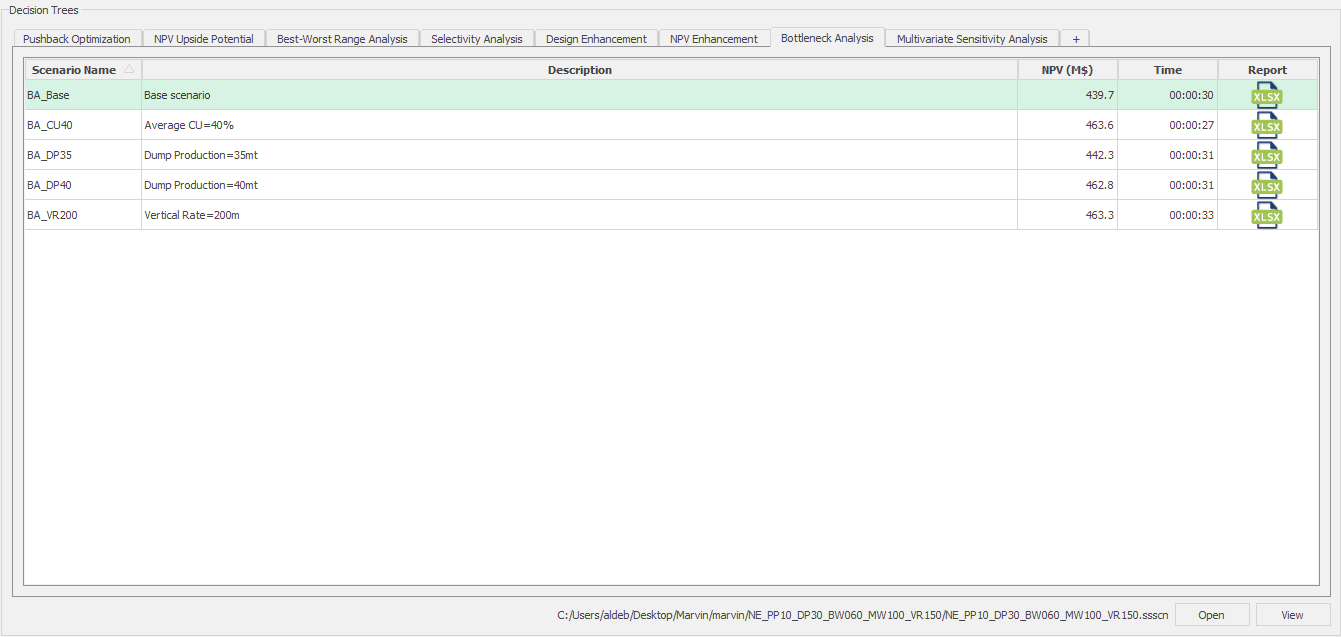
The graphs below depict a comparative analysis of the results for the scenarios in the decision tree.
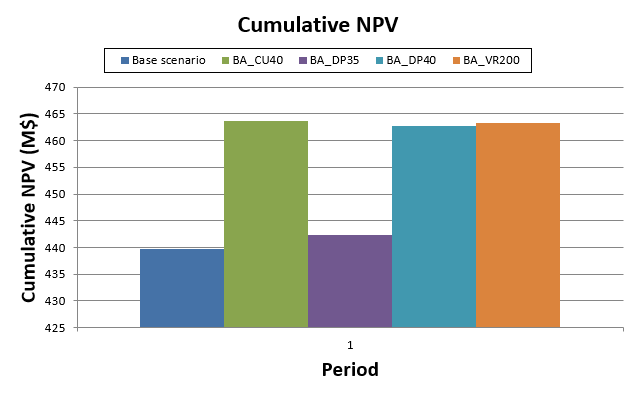
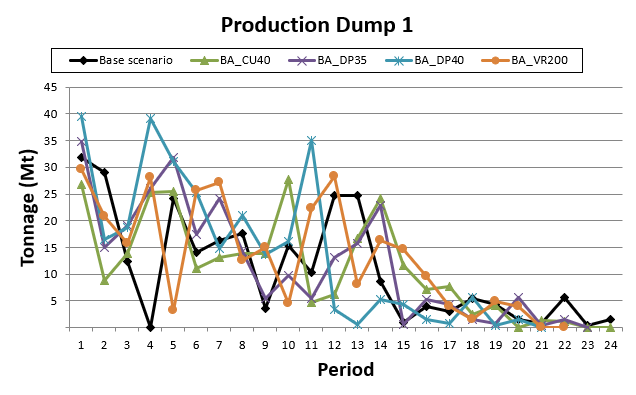
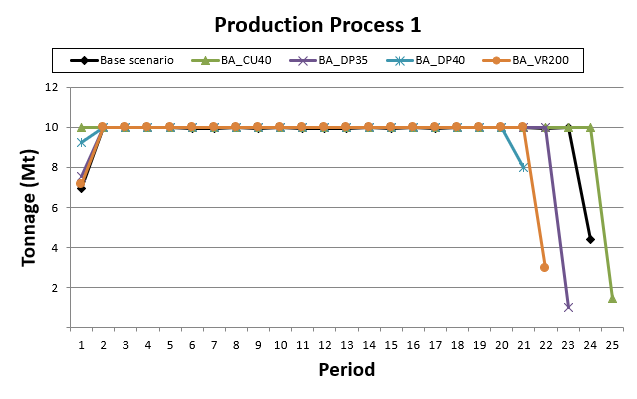
This analysis shows that the minimum average constraint of CU, production dump and vertical rate of advance are all restricting the base scenario. When relaxing these parameters, there is an increase of approximately 5% in the cumulative NPV, while the dump productions are kept within their limits and the process productions are closer to the target for some scenarios.
