Percent Models
Highlights
Representing mixed-material blocks accurately is essential for reliable planning in complex geological settings. Percent models enable a more nuanced understanding of ore-waste distribution.
- Allows precise modeling of blocks with multiple materials, supporting better resource estimation.
- Enhances processing decisions by accounting for internal variability.
- Helps MiningMath optimize cut-off strategies without oversimplifying geology.
MiningMath and percent models
MiningMath does not yet natively support percent models, but this feature is on our development roadmap. If you’d like to see this functionality prioritized, we encourage you to reach out to our support team.
In the meantime, you can use the formatting options below to prepare your percent model for use with MiningMath.
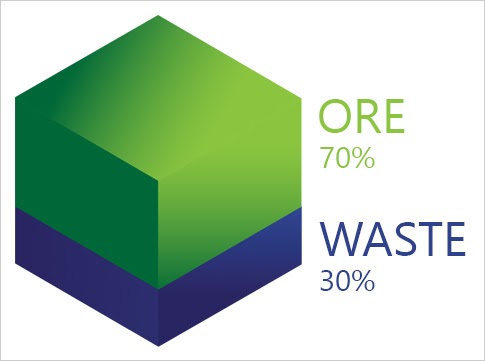
A percent model divides the mineral deposit into blocks while accounting for irregularities in the deposit’s shape. Instead of assuming each block is entirely filled with material, the percent model indicates the proportion of each block that actually contains valuable material.
Although this is not a mandatory step for the optimization process, the lithology can be defined considering:
- The tonnage of a block.
- The value of a block.
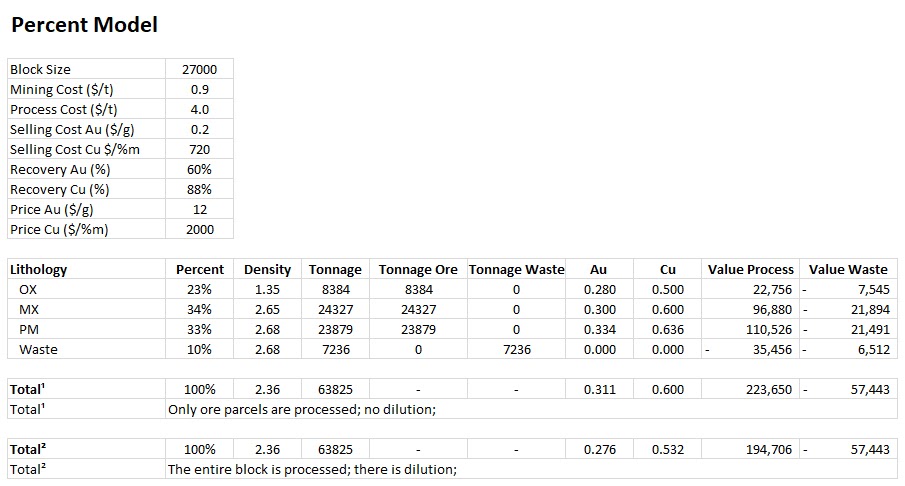
For example, consider the information of a block as depicted below:
- MX, if considering the greatest parcel in terms of tonnage.
PM, if considering the greatest parcel in terms of value.
[block size × density]. The average density of a block should be the weighted average, based on the lithologies present and their respective percentages.Recoveries should also be calculated based on the amount of material recovered from each parcel of the block.
The economic value is calculated considering the amount of material recovered from each parcel, along with their respective revenues and costs.
The economic value of a block can be calculated both with and without dilution:
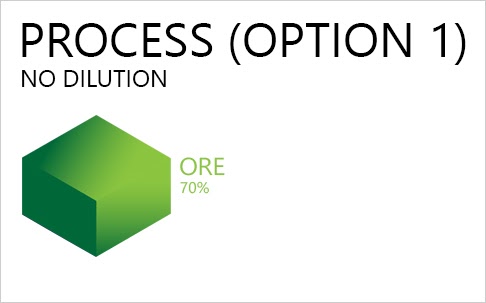
Without dilution (Option 1): Only ore parcels feed the plant
In this case, the economic value for the process will consist of Revenue - Costs, where:
• Revenue refers to the ore parcel (70%).
• Processing Costs refer to the ore parcel (70%).
• Mining Costs refer to the entire block (100%).Since MiningMath processes the entire block, input a higher value for the process limit, assuming the algorithm will feed the plant with the remaining parcel of waste (30%).
Additional steps
1) Create Auxiliary Columns: Track and control the tonnage limits of ore, waste, and any specific lithotype you want to monitor (as shown below).
2) Set Auxiliary Columns as "Other": During the import process, mark these auxiliary columns as "Other." This allows you to track and control the tonnages of each material.
3) Adjust Production Charts: Ignore the default production charts and instead use the tonnage charts set as "Other Constraints."
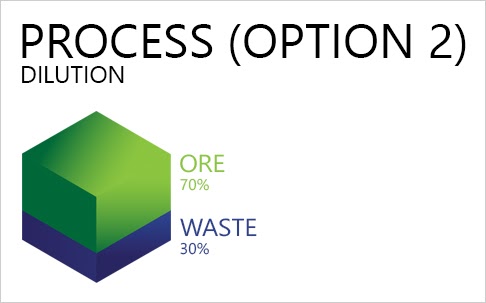
With dilution (Option 2): The entire block feeds the plant.
In this case, the economic value for the process will consist of Revenue - Costs, where:
• Revenue refers to the ore parcel (70%).
• Processing Costs refer to the entire block (100%).
• Mining Costs refer to the entire block (100%).Since there is dilution, the processing limit input in the interface should reflect the actual plant limit.
Additional steps
1) Create Auxiliary Columns: Use auxiliary columns to provide further control of the tonnages for each parcel, ensuring accurate tracking.
2) Adjust Processing Limit: Input the real plant limit in the processing limit field to account for dilution.
By using these adjustments, you can accurately model the economic value of blocks with dilution.
Single block example
The figure below depicts an example of calculations for a block composed of different lithotypes and its respective economic values assuming no dilution and diluted material (download the spreadsheet here).


