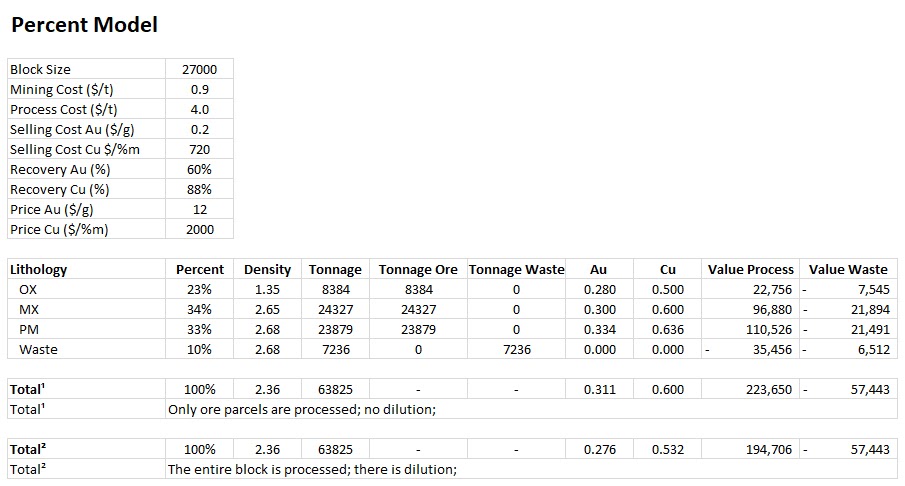
Percent Models

Without dilution (Option 1): Only ore parcels feed the plant

In this case, the economic value for the process will consist of Revenue - Costs, where:
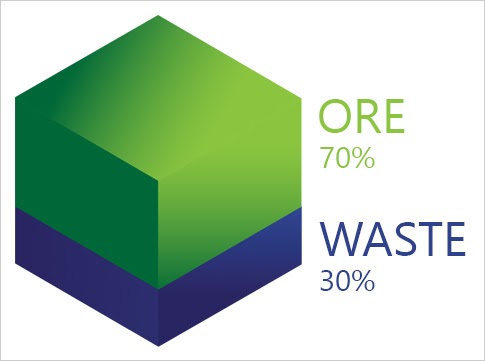
• Revenue refers to the ore parcel (70%).
• Processing Costs refer to the ore parcel (70%).
• Mining Costs refer to the entire block (100%).Since MiningMath processes the entire block, input a higher value for the process limit, assuming the algorithm will feed the plant with the remaining parcel of waste (30%).
Additional steps
1) Create Auxiliary Columns: Track and control the tonnage limits of ore, waste, and any specific lithotype you want to monitor (as shown below).
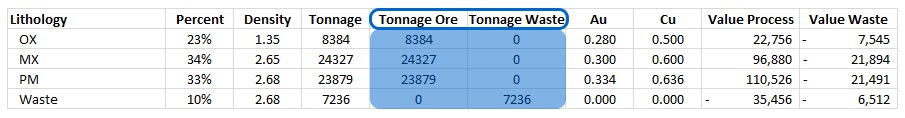
2) Set Auxiliary Columns as "Other": During the import process, mark these auxiliary columns as "Other." This allows you to track and control the tonnages of each material.
3) Adjust Production Charts: Ignore the default production charts and instead use the tonnage charts set as "Other Constraints."
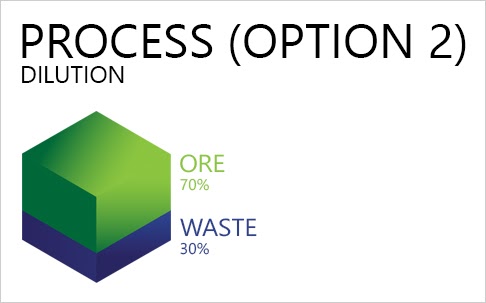
With dilution (Option 2): The entire block feeds the plant.
In this case, the economic value for the process will consist of Revenue - Costs, where:
• Revenue refers to the ore parcel (70%).
• Processing Costs refer to the entire block (100%).
• Mining Costs refer to the entire block (100%).Since there is dilution, the processing limit input in the interface should reflect the actual plant limit.
Additional steps
1) Create Auxiliary Columns: Use auxiliary columns to provide further control of the tonnages for each parcel, ensuring accurate tracking.
2) Adjust Processing Limit: Input the real plant limit in the processing limit field to account for dilution.
By using these adjustments, you can accurately model the economic value of blocks with dilution.