Modelos de porcentaje
Reflejos
La representación precisa de bloques de materiales mixtos es esencial para una planificación confiable en entornos geológicos complejos.. Los modelos porcentuales permiten una comprensión más matizada de la distribución de desechos minerales..
- Permite el modelado preciso de bloques con múltiples materiales., Apoyando una mejor estimación de recursos.
- Mejora las decisiones de procesamiento al tener en cuenta la variabilidad interna.
- Ayuda a MiningMath a optimizar las estrategias de corte sin simplificar demasiado la geología.
MiningMath y modelos porcentuales
MiningMath aún no admite de forma nativa modelos de porcentaje, pero esta característica está en nuestra hoja de ruta de desarrollo. Si desea ver esta funcionalidad priorizada, Te animamos a que te pongas en contacto con nosotros. equipo de apoyo.
Mientras tanto, Puede utilizar las opciones de formato a continuación para preparar su modelo de porcentaje para usar con MiningMath.
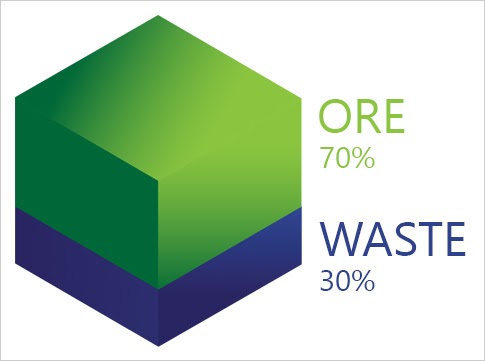
Un modelo porcentual divide el depósito mineral en bloques teniendo en cuenta las irregularidades en la forma del depósito.. En lugar de asumir que cada bloque está completamente lleno de material, El modelo porcentual indica la proporción de cada bloque que realmente contiene material valioso..
Aunque este no es un paso obligatorio para el proceso de optimización, la litología se puede definir considerando:
- El tonelaje de un bloque.
- El valor de un bloque..
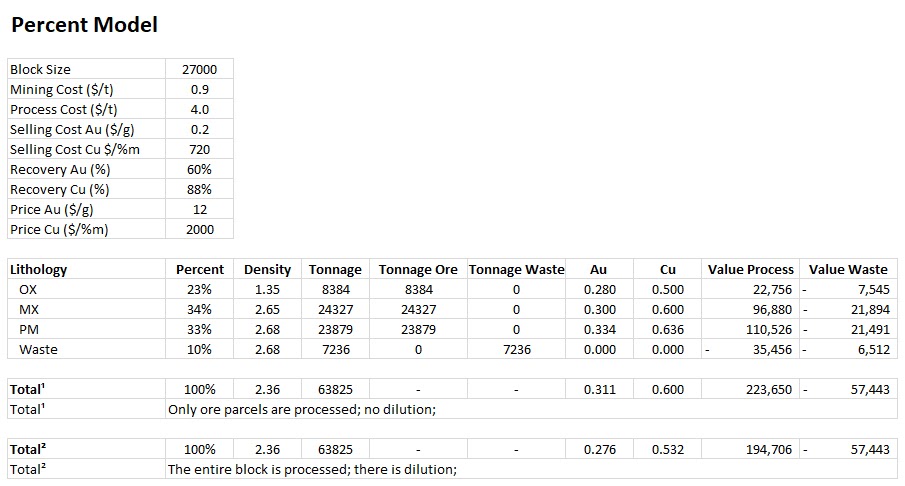
Por ejemplo, Considere la información de un bloque como se muestra a continuación:
- MX, si se considera la parcela más grande en términos de tonelaje.
PM, Si se considera la parcela más grande en términos de valor.
[block size × density]. La densidad media de un bloque debe ser el promedio ponderado, en función de las litologías presentes y sus respectivos porcentajes.Las recuperaciones también deben calcularse en función de la cantidad de material recuperado de cada parcela del bloque..
El valor económico se calcula considerando la cantidad de material recuperado de cada paquete, junto con sus respectivos ingresos y costos.
El valor económico de un bloque se puede calcular tanto con como sin dilución:
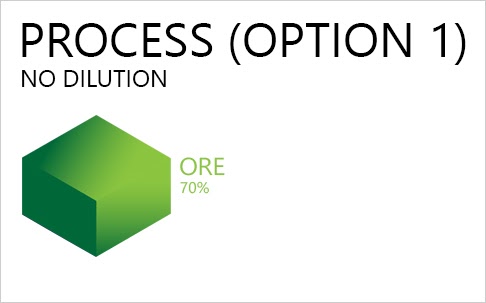
sin dilución (Opción 1): Sólo las parcelas de mineral alimentan la planta
En este caso, la valor económico porque el proceso consistirá en Ingresos - Costos, donde:
• Ingresos se refiere a la parcela de mineral (70%).
• Tratamiento Costos consulte el paquete de mineral (70%).
• Costos Mineros hacer referencia a todo el bloque (100%).Dado que MiningMath procesa el bloque completo, Introduzca un valor más alto para el límite del proceso, suponiendo que el algoritmo alimentará a la planta con el paquete restante de residuos (30%).
Pasos adicionales
1) Crear columnas auxiliares: Seguimiento y control de los límites de tonelaje del mineral., desperdicio, y cualquier litotipo específico que quieras monitorear (Como se muestra abajo).
2) Establecer columnas auxiliares como "Otro": Durante el proceso de importación, Marca estas columnas auxiliares como "Otro." Esto le permite rastrear y controlar los tonelajes de cada material..
3) Ajustar los gráficos de producción: Ignore las tablas de producción predeterminadas y, en su lugar, utilice las tablas de tonelaje configuradas como "Otras restricciones."
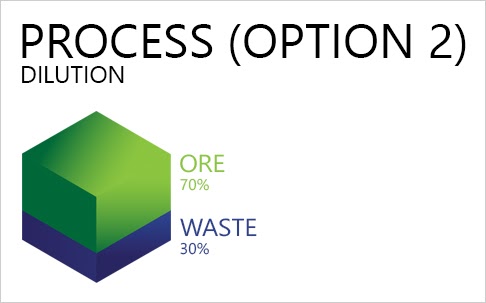
con dilución (Opción 2): Todo el bloque alimenta la planta..
En este caso, la valor económico porque el proceso consistirá en Ingresos - Costos, donde:
• Ingresos se refiere a la parcela de mineral (70%).
• Tratamiento Costos hacer referencia a todo el bloque (100%).
• Costos Mineros hacer referencia a todo el bloque (100%).Dado que hay dilución, El límite de procesamiento ingresado en la interfaz debe reflejar el límite real de la planta..
Pasos adicionales
1) Crear columnas auxiliares: Utilice columnas auxiliares para proporcionar un mayor control de los tonelajes de cada paquete., garantizar un seguimiento preciso.
2) Ajustar el límite de procesamiento: Introduzca el límite real de la planta en el campo de límite de procesamiento para tener en cuenta la dilución..
Al utilizar estos ajustes, Puede modelar con precisión el valor económico de los bloques con dilución..
Ejemplo de bloque único
La siguiente figura muestra un ejemplo de cálculos para un bloque compuesto por diferentes litotipos y sus respectivos valores económicos asumiendo que no hay dilución y que el material está diluido. (Descargar la hoja de cálculo aquí).


